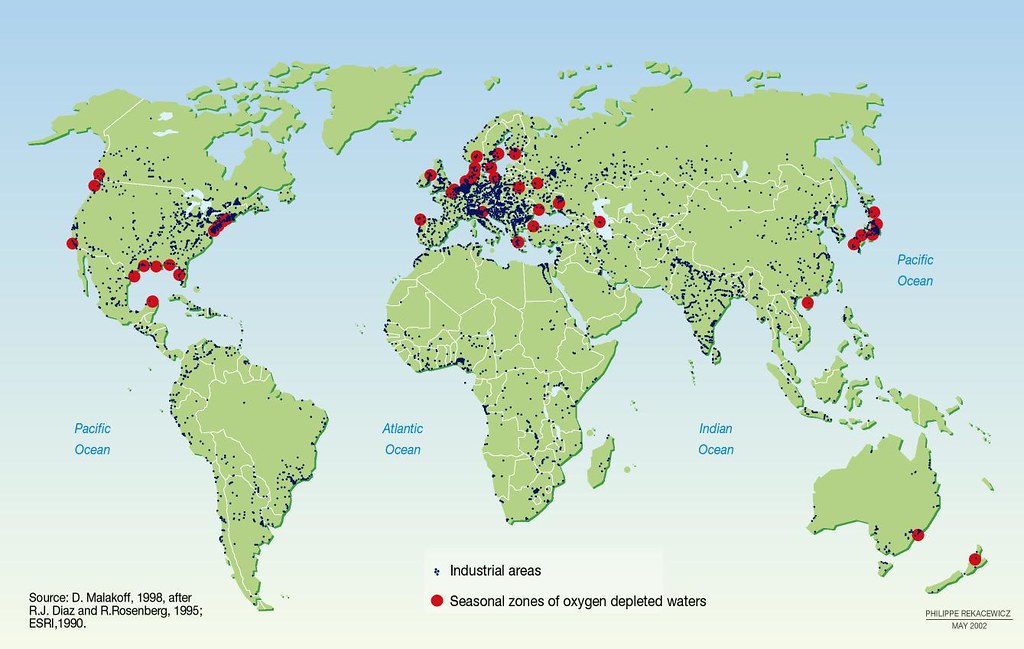
Industrial areas and seasonal zones of oxygen depleted waters
This graphic illustrates the strong link between areas with high densities of industrial activity and zones of seasonally oxygen-depleted waters. There is a strong link between areas with high densities of industrial activity and zones of seasonal oxygen-depleted waters. In recent years there has been an increasing focus on treating and reducing municipal and industrial waste, and on reducing nitrogen levels in agricultural runoff. However, less attention has been paid to the continually increasing nitrogen emissions into the atmosphere. It is believed that between 10% and 70% of the fixed nitrogen input in many coastal regions is currently delivered by rain and the fallout of nitrogen compounds from the atmosphere. GESAMP (Joint Group of Experts on the Scientific Aspects of Marine Environment Protection) recommends that atmospheric nitrogen must be included among the nutrient sources assessed as part of the management of coastal water quality. Political factors are also of major significance, as the primary causes of atmospheric anthropogenic nitrogen result from energy generation and transportation, and thus from society’s economic and social activities (GESAMP, 2001). Urgent actions to control land-based activities: At the technical, management and policy levels, the most urgent actions needed, for controlling land-based activities, in order to improve the quality of the marine environment, are: - prevent habitat destruction and the loss of biodiversity through education, combined with the development and enforcement of legal, institutional and economic measures appropriate to local circumstances - establish protected areas for habitats and sites of exceptional scenic beauty or cultural value - devote primary management attention to the control of pollution from sewage, nutrients (especially nitrogen) and sediment mobilization - design national policies that take account of the economic value of environmental goods and services, and provide for the internalization of environmental costs - integrate the management of coastal areas and associated watersheds (GESAMP, 2001) It has been estimated that about 80% of all marine pollution originates from land-based activity, reaching the ocean directly, via rivers, or through atmospheric depositions: - Inputs of nitrates to the North Sea, for example, have risen four-fold, and phosphate inputs eight-fold, since the 1970s, causing eutrophication and tides of toxic algae that have killed stocks in offshore fish farms (Harrison and Pearce, 2001). - Severe eutrophication has been discovered in several enclosed or semi-enclosed seas (UNEP, 2002). - Eutrophication has been linked to the formation of ‘dead zones’ on the ocean floor. One of the largest known ’dead zones’ is found along the United States shoreline of the Gulf of Mexico, which receives large volumes of fertilizer from the Mississippi River system (Harrison and Pearce, 2001). - The collapse of the Baltic Sea cod fishery in the early 1990s is blamed on oxygen loss in deep waters due to eutrophication, which interfered with the development of cod eggs. - Eutrophication can also cause harmful algal blooms (HABs), which can harm fish and shellfish, as well as the people who consume them. Some algae can cause negative effects when they appear in dense blooms, while others have such potent neurotoxins they do not need to be present in large numbers.
Year: 2009
From collection: Vital Water Graphics 2
Cartographer: Philippe Rekacewicz, February 2006