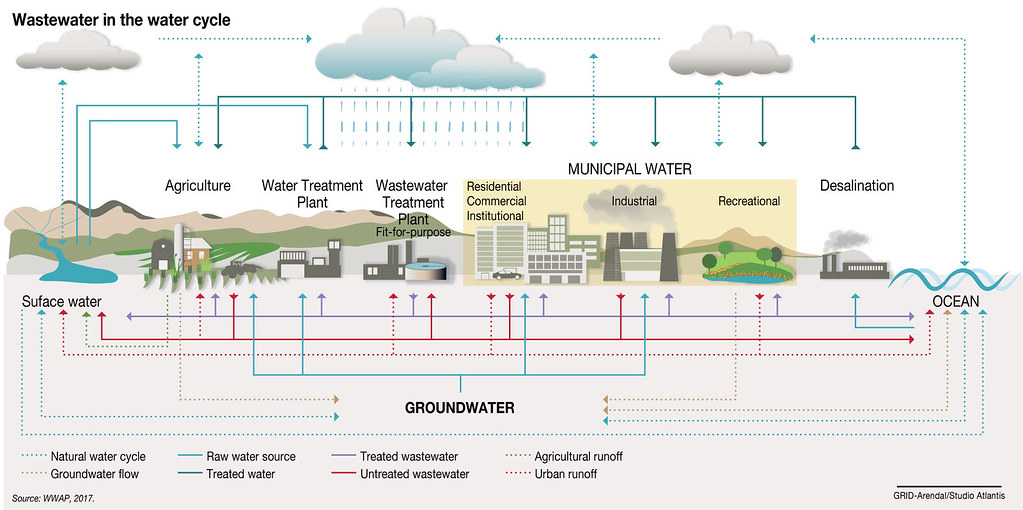
Wastewater in the water cycle
The World Water Development Report (WWDR) stated that only 20 per cent of globally produced wastewater was receiving adequate treatment in 2012, adding that there seems to be a correlation between the treatment capacity and the income level of the country (WWAP 2017). Treatment capacity in 2012 was reported to be 70 per cent of the generated wastewater in high-income countries, compared to only 8 per cent in low-income countries (WWAP 2017). The consequence of such practices include increased disease burden as well as significant damage to key ecosystems. Studies have also revealed that contamination from these streams usually finds its way into freshwater resources, resulting in increased levels of eutrophication and loss of some ecosystem services. Wastewater can also easily pollute groundwater due to the percolation process.
Year: 2020
From collection: Sanitation and Wastewater Atlas of Africa - Overview
Cartographer: GRID-Arendal/Studio Atlantis